

Data Analysis and Visualization with Python
This course is part of Python: From Basics to Real-World Applications.
This course cannot be purchased separately - to access the complete learning experience, graded assignments, and earn certificates, you'll need to enroll in the full Python: A Guided Journey from Introduction to Application Specialization program. You can audit this specific course for free to explore the content, which includes access to course materials and lectures. This allows you to learn at your own pace without any financial commitment.
2,040 already enrolled
Instructors:

English
Powered by

What you'll learn
Analyze data using Python libraries and tools
Create effective data visualizations
Manipulate and process large datasets
Handle file operations and exceptions
Use data structures for analysis
Skills you'll gain
This course includes:
1.9 Hours PreRecorded video
12 quizzes
Access on Mobile, Tablet, Desktop
FullTime access
Shareable certificate
Get a Completion Certificate
Share your certificate with prospective employers and your professional network on LinkedIn.
Created by
Provided by

Top companies offer this course to their employees
Top companies provide this course to enhance their employees' skills, ensuring they excel in handling complex projects and drive organizational success.


There are 3 modules in this course
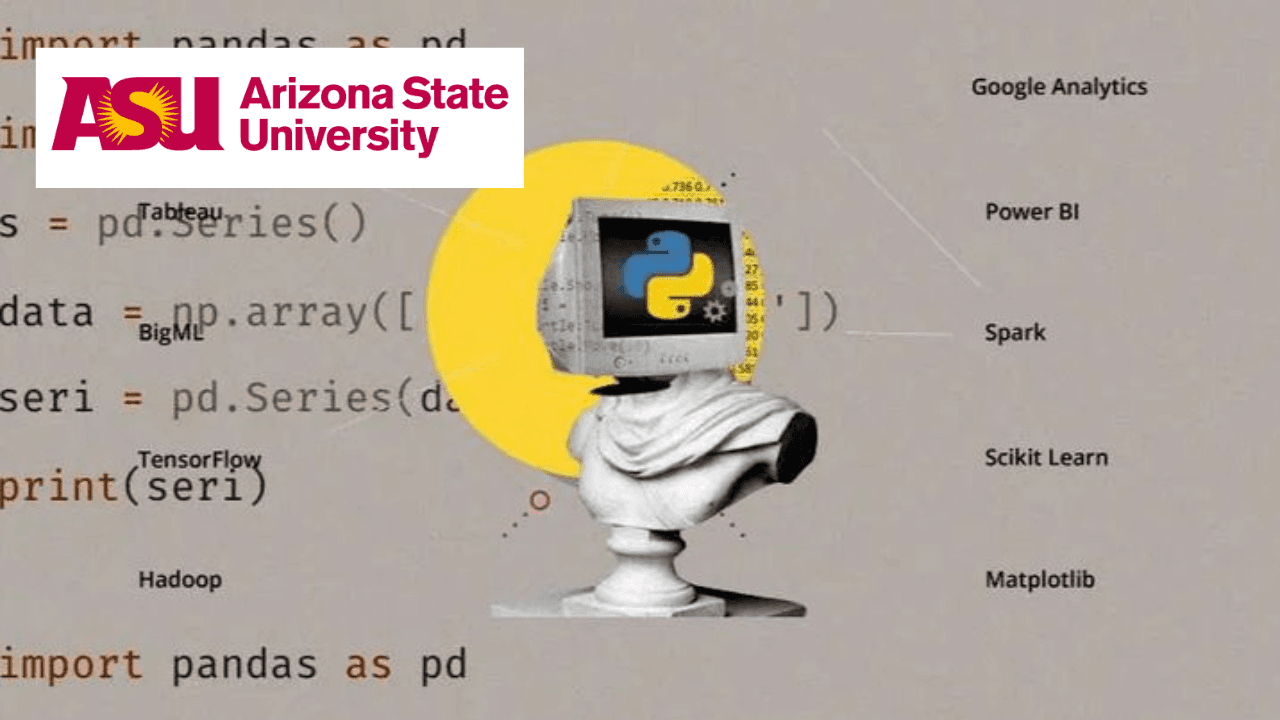
This comprehensive course teaches data analysis and visualization using Python. Students learn to work with data structures like lists, tuples, dictionaries, and sets, while mastering essential libraries including NumPy, Pandas, and Matplotlib. The curriculum covers file input/output operations, data manipulation, and creating insightful visualizations. Topics include exception handling, data processing, and statistical analysis techniques.
Sequences
Module 1 · 6 Hours to complete
File Input and Output
Module 2 · 4 Hours to complete
Data Analysis
Module 3 · 5 Hours to complete
Fee Structure
Individual course purchase is not available - to enroll in this course with a certificate, you need to purchase the complete Professional Certificate Course. For enrollment and detailed fee structure, visit the following: Python: From Basics to Real-World Applications
Instructors

Assistant Teaching Professor
Adwith Malpe is a Computer Engineer with a Master’s degree in Computer Engineering and a Bachelor’s in Computer Systems Engineering from Arizona State University. His industry experience spans both the financial and aerospace sectors, with a strong focus on Computer Science.

Assistant Teaching Professor at Arizona State University
Steven Osburn is an Assistant Teaching Professor at Arizona State University, where he specializes in computer science and data analysis. He teaches courses such as "Data Analysis and Visualization with Python" and "Object-Oriented Programming and GUI with Python," focusing on equipping students with essential programming and analytical skills. His teaching approach emphasizes hands-on learning and practical applications, preparing students for real-world challenges in technology and data science.In addition to his teaching responsibilities, Steven is actively involved in curriculum development and student engagement initiatives within the Ira A. Fulton Schools of Engineering. His courses on Coursera are designed to make complex topics accessible to learners, helping them build a solid foundation in programming and data visualization techniques. Through his work, Steven aims to inspire the next generation of engineers and data scientists.
Testimonials
Testimonials and success stories are a testament to the quality of this program and its impact on your career and learning journey. Be the first to help others make an informed decision by sharing your review of the course.
Frequently asked questions
Below are some of the most commonly asked questions about this course. We aim to provide clear and concise answers to help you better understand the course content, structure, and any other relevant information. If you have any additional questions or if your question is not listed here, please don't hesitate to reach out to our support team for further assistance.